

Data Analytics – Precursor to Delightful CX
Data analytics is not limited to big corporations and data warehousing, anymore. Business success factors such as customer experience and customer retention, drove corporations and SMEs alike, to use data analytics as a precursor to providing apt and delightful customer experience.
Earlier, customer experience was limited to the customer’s interaction with the vendor/consultant. This was followed by their experience of the product or service. Today, techniques like inbound marketing are firing up the lead generation and conversion processes. To make the most of these techniques, you can ask yourself (or your marketing team) the following questions:
- Who are the people who are looking for our business offering?
- What are the exact services they are looking for?
- What are the channels through which we can approach them?
- How likely are they to convert into customers?
Data analytics can help answer these questions. With the right analytics dashboard, you can make the most of the information that you collect from customers. With a simple questionnaire you can have all that you need to know about your current and potential customers.
Recent Roars Project was about creating a Data Analytics Dashboard
Roars Technologies was thrilled to implement its recent project which was to create an analytics dashboard for their client. Roars had already excelled in creating minimum viable products and apps for its clients, over the years. The creation of a data analytics dashboard was a whole new ballgame altogether. Not only did it require a different approach but a different process, altogether.
Requirements:
The client, an established retail company, wanted a data analytics dashboard. The idea was to feed the software with client information to help segregate the data further as per demographics, profession, preferences, and purchase.
Result expected:
With this data analytics dashboard, the client is looking to create reports with which they can send targeted messages to their customers. This will increase the chances of sale and lead conversions as customers will see exactly what they like and want to buy.
Further, keeping in mind importance of dates such as birthdays and anniversaries and festivals, the client can send targeted ads at the right time to the right customer.
The same advertising and marketing technique cannot yield the desired results for the entire set of target customers. Even among the universal set of target audience lies subsets of audience who prefer messages at certain times of the day, through certain social media channels. A data analytics dashboard helps identify just that.
Data collected:
The client requested their patrons to fill out a questionnaire with questions about:
- Demographics – name, age, gender, marital status, contact details, and address
- Personal background – hobbies and interests, favorite social media channels
- Product preferences – kind of product they prefer from the client’s extensive catalog
- Lifestyle – situations or needs that impact purchases, how they make the purchases, etc.
As you can see, each set of question delves into deeper details.
All this data is well-encrypted and protected for privacy and security purposes.
A Glimpse into Roars’ Data Analytics Project
Roars created the data analytics dashboard in a way that is easy to adopt and adapt to. The dashboard is handled by the client’s agents who are tasked with collecting information from the customers and filling up the online questionnaire. This ensures higher number of completed profiles and better targeting & segmentation.
For the benefit of the agents and for the concerned authorities who work with the dashboard, Roars maintained a clean UI and easy UX. Hence the white background and color-coded parameters.
 Main
Main
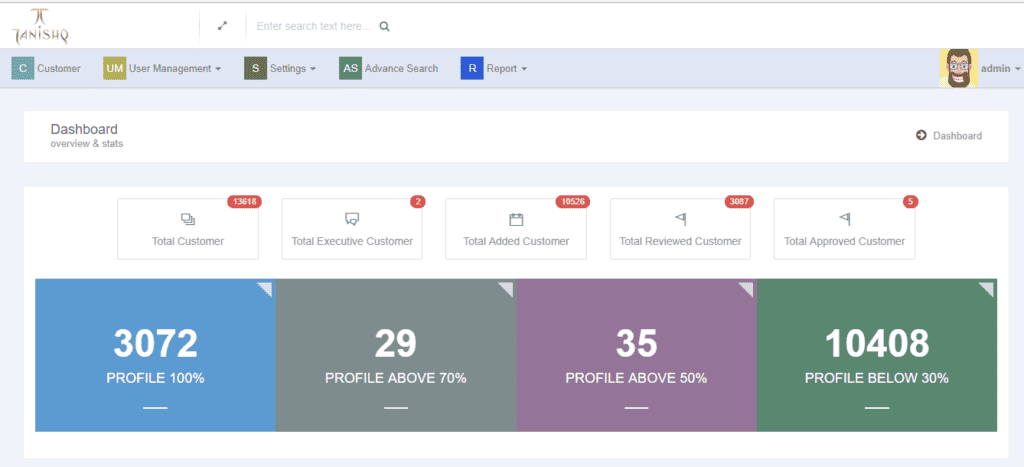
Dashboard of the Data Analytics Software
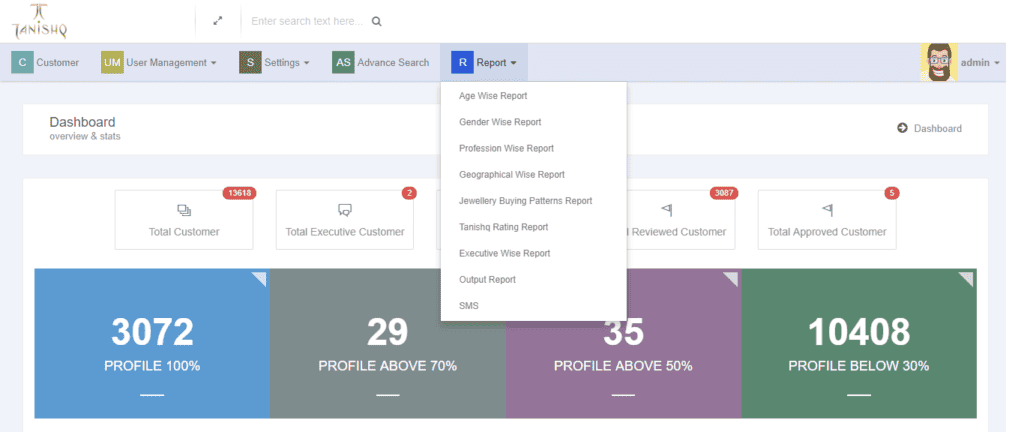
Upon selecting the tabs, at the top, the drop down menu gives access to further insightful information. Users can click on the “Report” tab and generate the kind of report they wish to study.
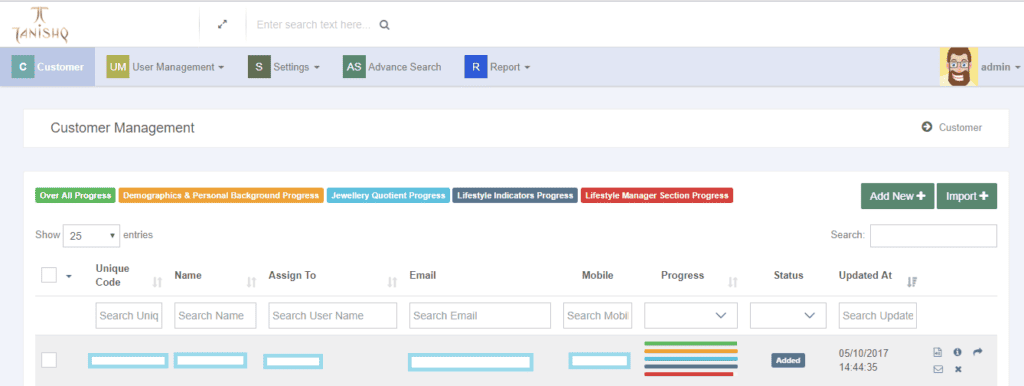
Upon clicking each customer profile, the report gives an insight to their data, such as name, the agent they are assigned to, email address, contact number, and also the progress rate of each customer data inquiry. This helps agents keep a tab as to who are the customers whose profiles are yet to be filled.
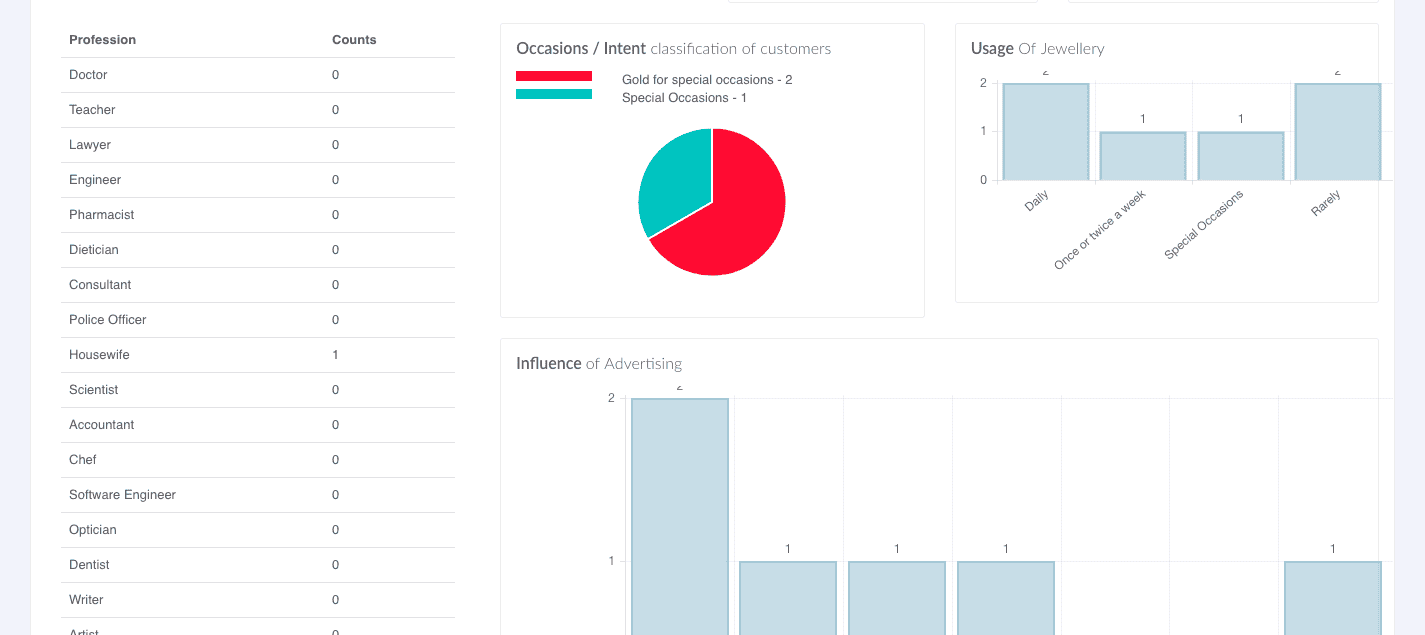
Clients can also create and export reports in the form of graphs, bar-charts and pie-charts for better visual representation of the analytics. This helps understand data segregation well while helping clients take quicker decisions, based on the graph reports.
Finally, here is a closer look at the parameters that Roars defined to ensure all areas are covered and all customer information is properly filed and checked.
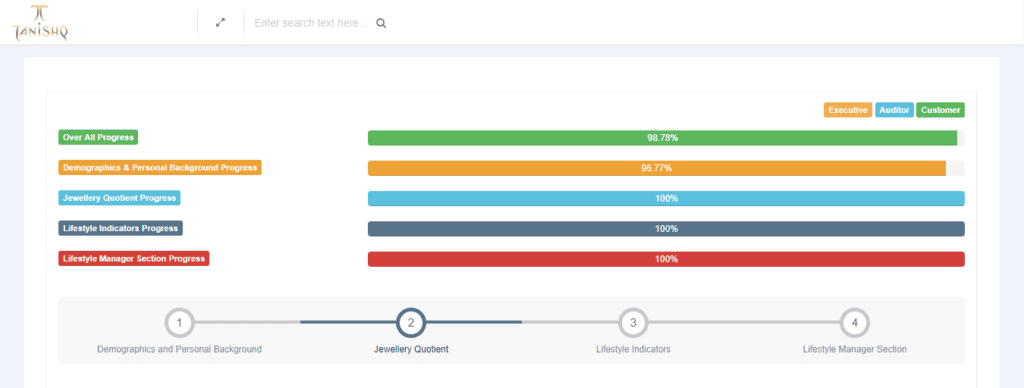
The dashboard serves as a place to store and file relevant customer data from where the analytics take on the job of customer segregation based on the various parameters. The data analytics results of your present customer not only give you an idea of what kind of product or service they prefer but also, to that of your potential customers.
What to do once you have the analytics report?
Once you have the analytics report with you, you can clearly find a pattern of customer behavior that corresponds to the your product/service offering. Using this pattern you can draw up some fictional client profiles and create a master marketing plan for each profile. You can then apply this plan to both your existing as well as potential customers who fit in the respective profile. We call this profile a ‘persona‘. You can learn more about how to create these profiles, what they look like and how they can help over here.
As mentioned earlier, data analytics is the precursor to creating a great customer experience. It helps you know your customers better and helps you pitch to them what THEY want instead of something YOU want to sell them. Once they realize that you are selling them products that fit their needs, they will start trusting you more thus, starting a long & loyal customer relationship.
Data analytics can actually decrease your costs and boost your revenues. Let’s talk about how we can boost your business’ revenues by implementing a customized data analytics dashboard for your business.